
Share:
Synopsis
- The journey of Small Finance Banks (SFBs), which were envisaged as financial inclusion vehicles to provide credit to the non-banked and underbanked population of the country, has been marked by resilience amid numerous obstacles starting from events like demonetisation and its after-effects, GST implementation, NBFC crisis of 2018, private banks fiasco of 2020 affecting deposits and more recently the Covid-19 pandemic.
- Covid-19 hit SFBs hard during FY21 and FY22 due to the exposure to economically weaker borrower profiles causing higher delinquencies and an increase in credit costs impacting profitability. Most SFBs saw a reduction of their profitability with some even incurring losses and many SFBs were looking to raise growth capital during FY22.
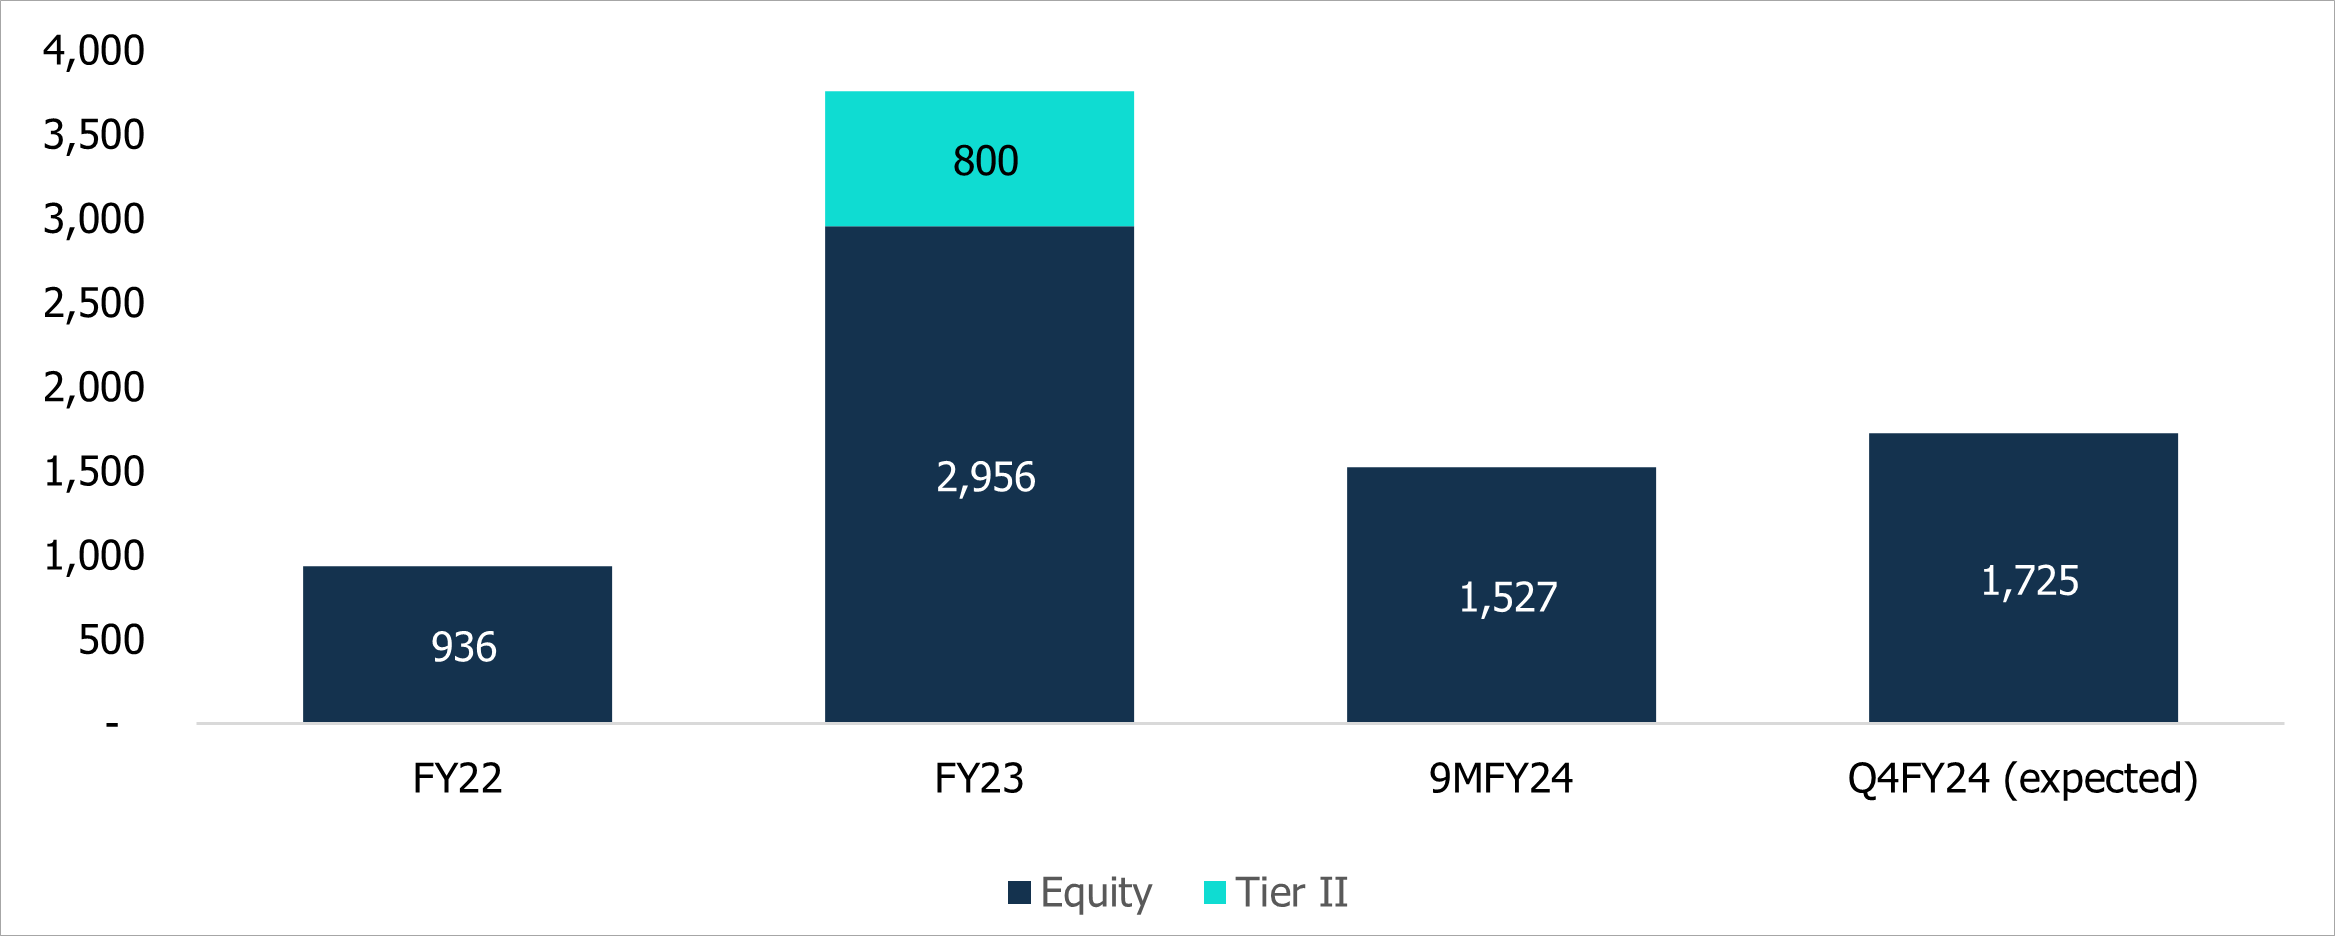
- With the improvement in the economic landscape and financial performance of SFBs, there has been an increasing investor interest for the sector in the current year with few players raising equity through their maiden IPOs. During 9MFY24, SFBs raised equity capital aggregating ₹1,527 crore and around ₹1,725 crore is expected to be raised during Q4FY24.
- With the credit cost worries behind and access to capital, the SFBs are poised for a strong growth period. CareEdge Ratings expects SFB advances and deposits growth of 22-25% and report stable profitability with ROTA in the range of 2.1% to 2.4% for FY24.
- The sector has also recently witnessed announcements of a couple of mergers for inorganic growth. However, these are event specific and CareEdge Ratings do not envisage any major consolidation in the industry.
Growing deposit franchise, CASA remains a challenge
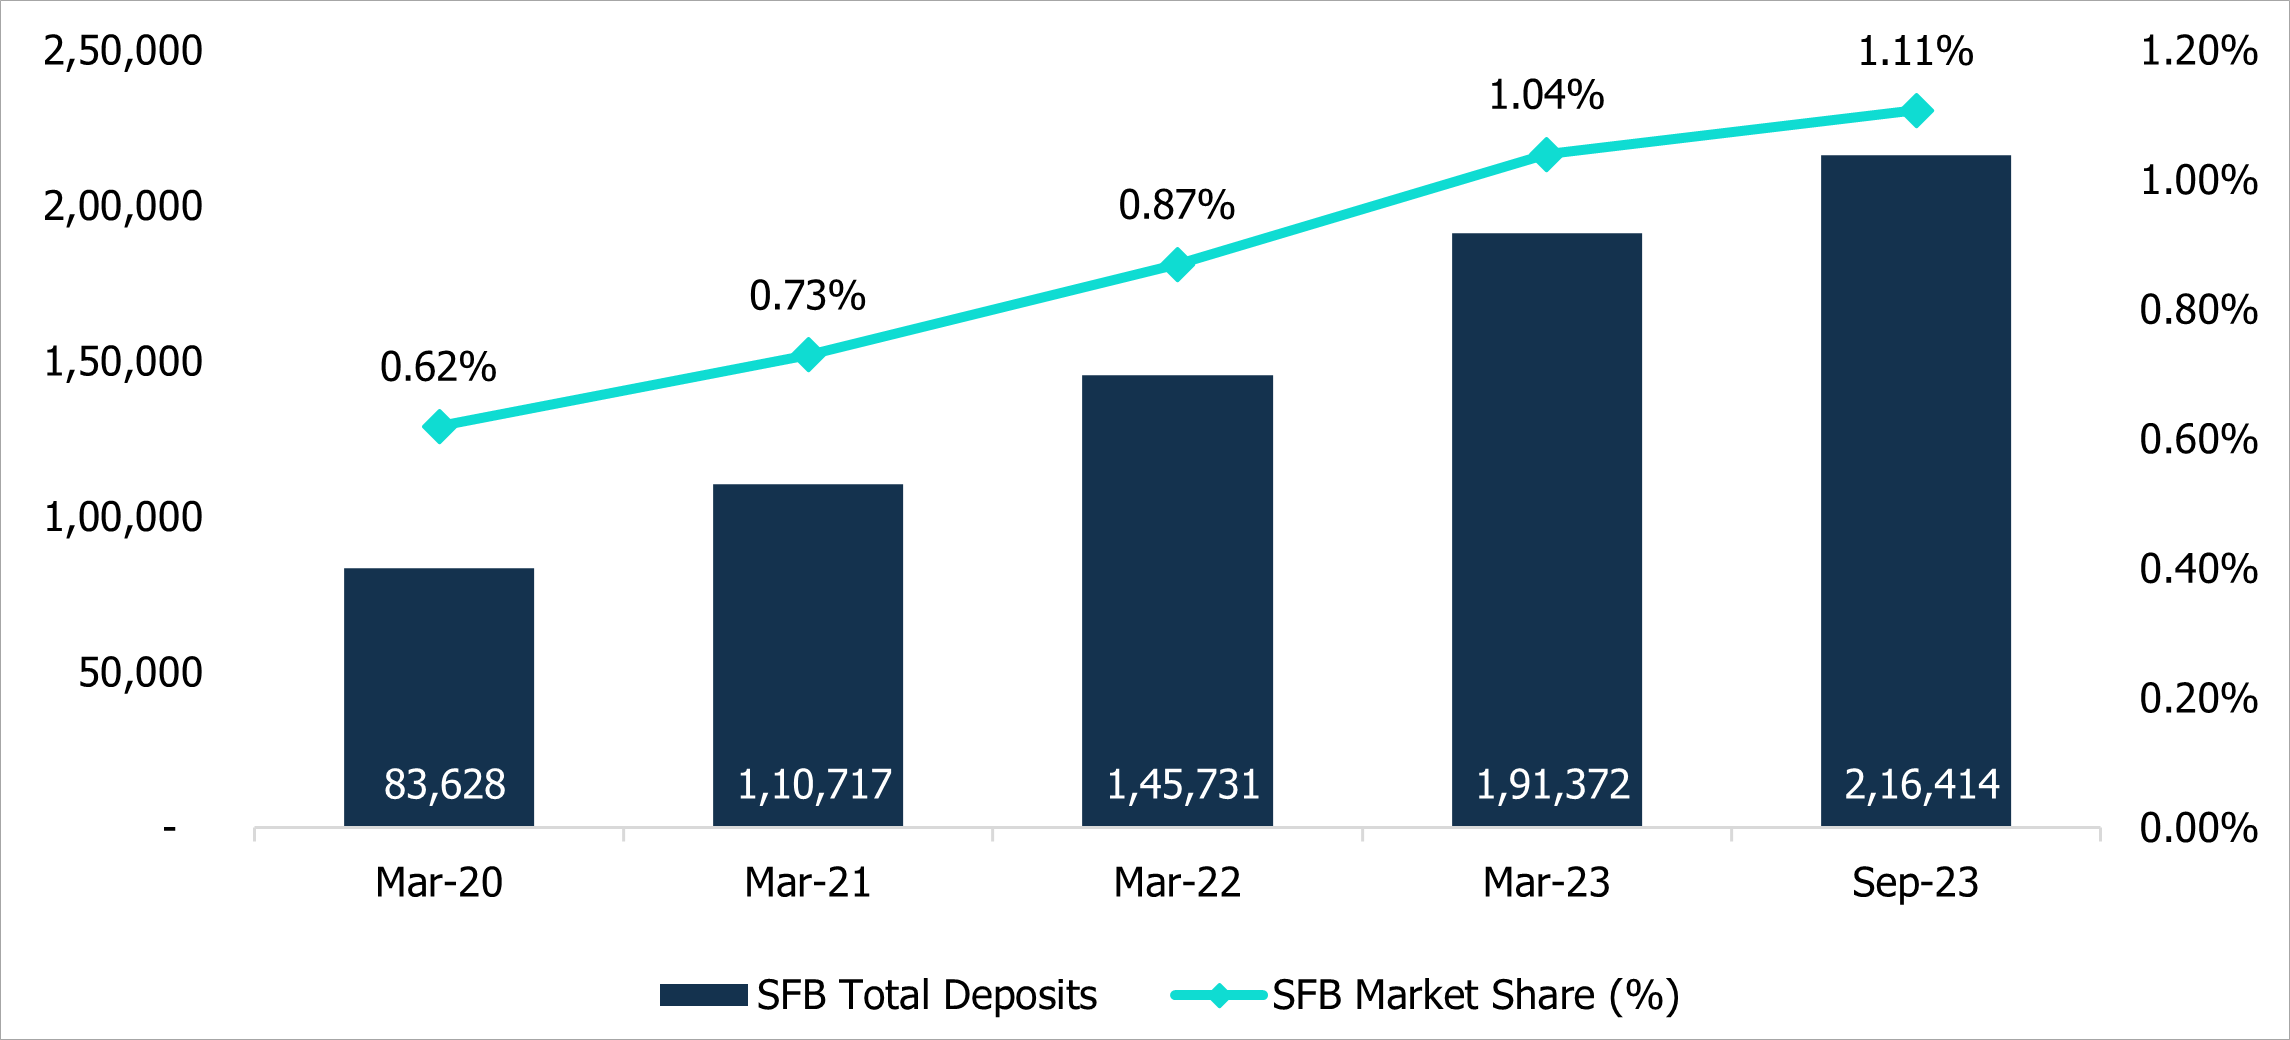
The strong focus on building a liability franchise comparable to that of universal banks and the relatively higher rate of interest offered to depositors have resulted in SFB deposits growing faster than the banking industry. Deposits of SFBs grew at a CAGR of 32% during the period from FY20 to FY23 as against a CAGR of 11% for banking sector deposits. SFBs deposit share of the overall banking industry has improved over the past few years although the proportion is relatively smaller.
Figure 1: Trend of Deposits and market share
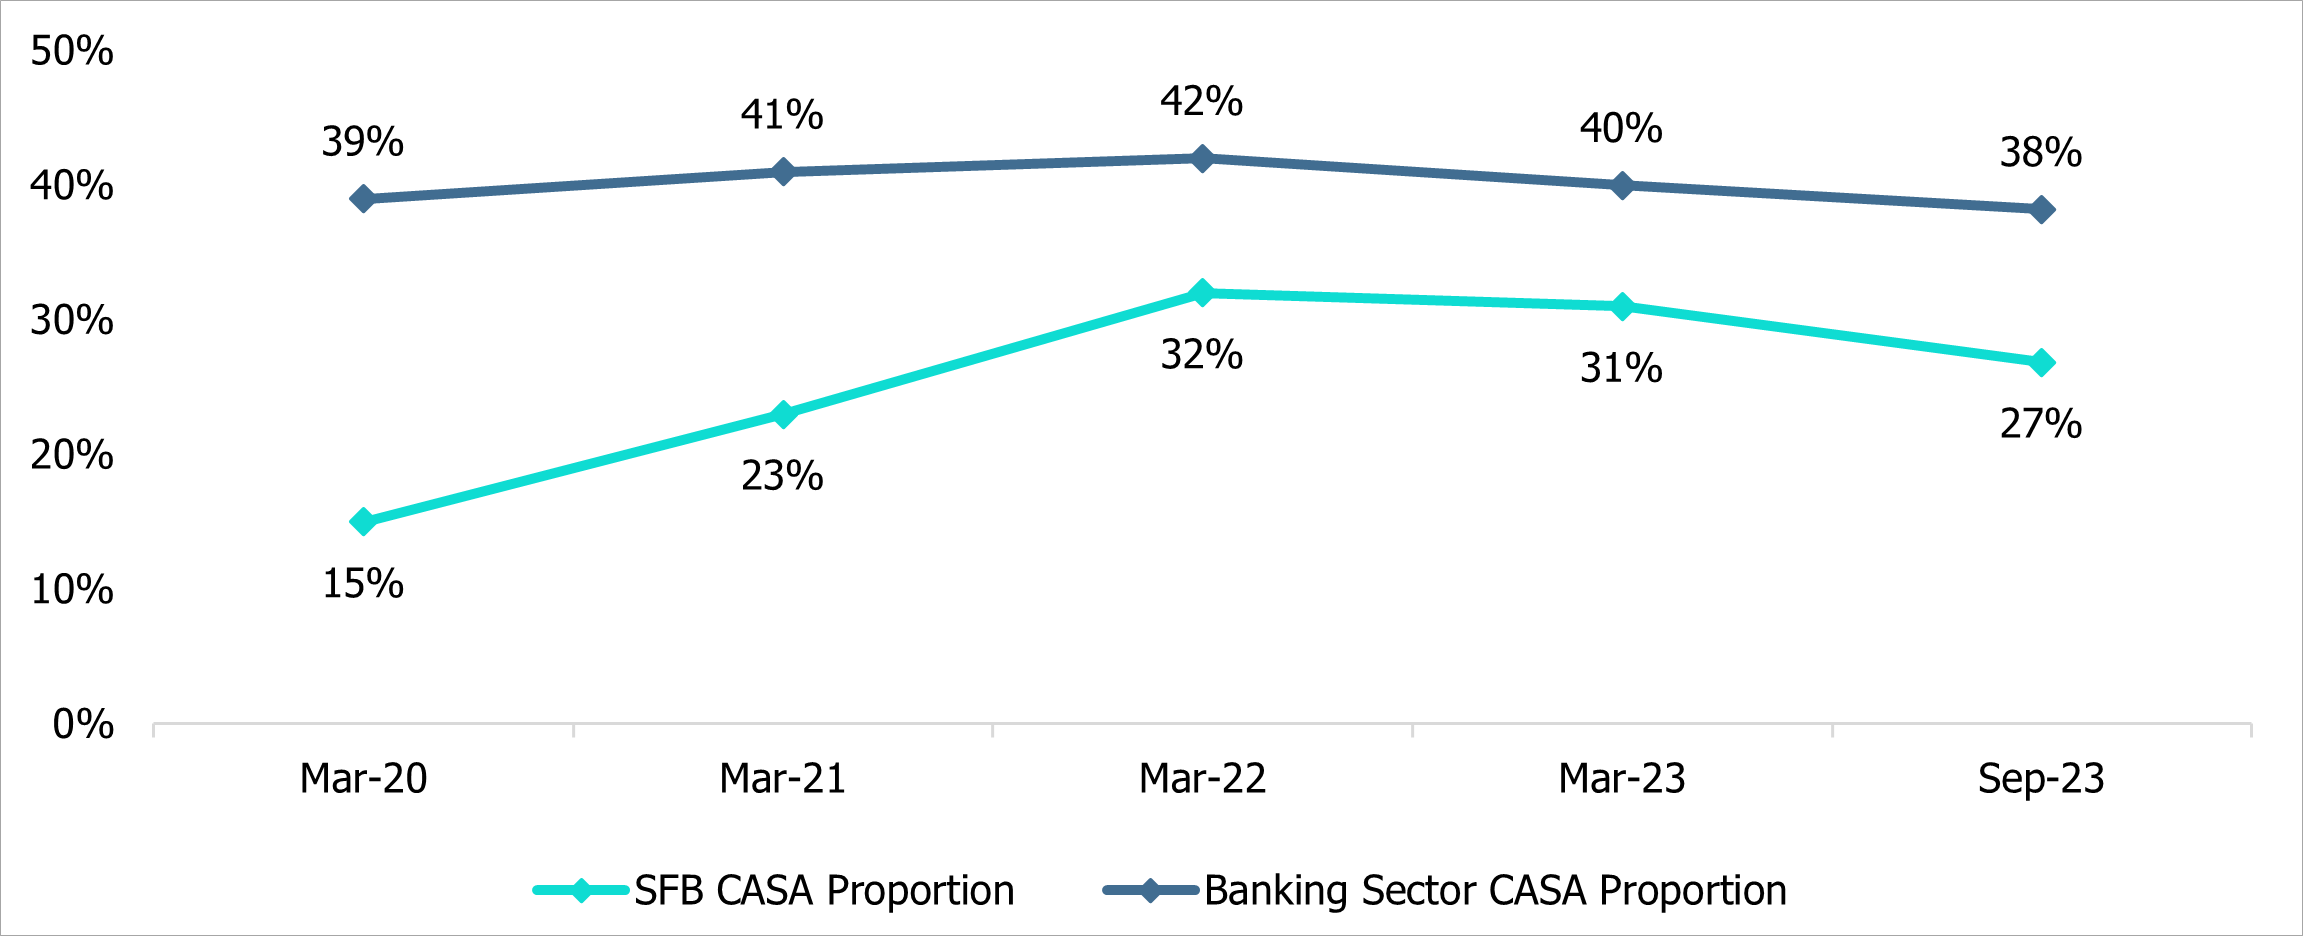
As most of the SFBs transitioned from being NBFCs, SFBs faced the challenge of mobilisation of deposits; however, SFBs have done a commendable job of building their deposit franchise by setting up liabilities-focused branches. The Credit to Deposit (C/D) ratio has fallen over a period of time as SFBs replaced borrowings with deposits. While SFBs have been building their deposit base by providing relatively higher interest rates, building up a stable Current Account and Savings Account (CASA) base will continue to remain a challenge with stiff competition from established commercial banks. The CASA deposit ratio for SFBs continues to trail behind the banking sector.
Figure 2: Credit to Deposit Ratio
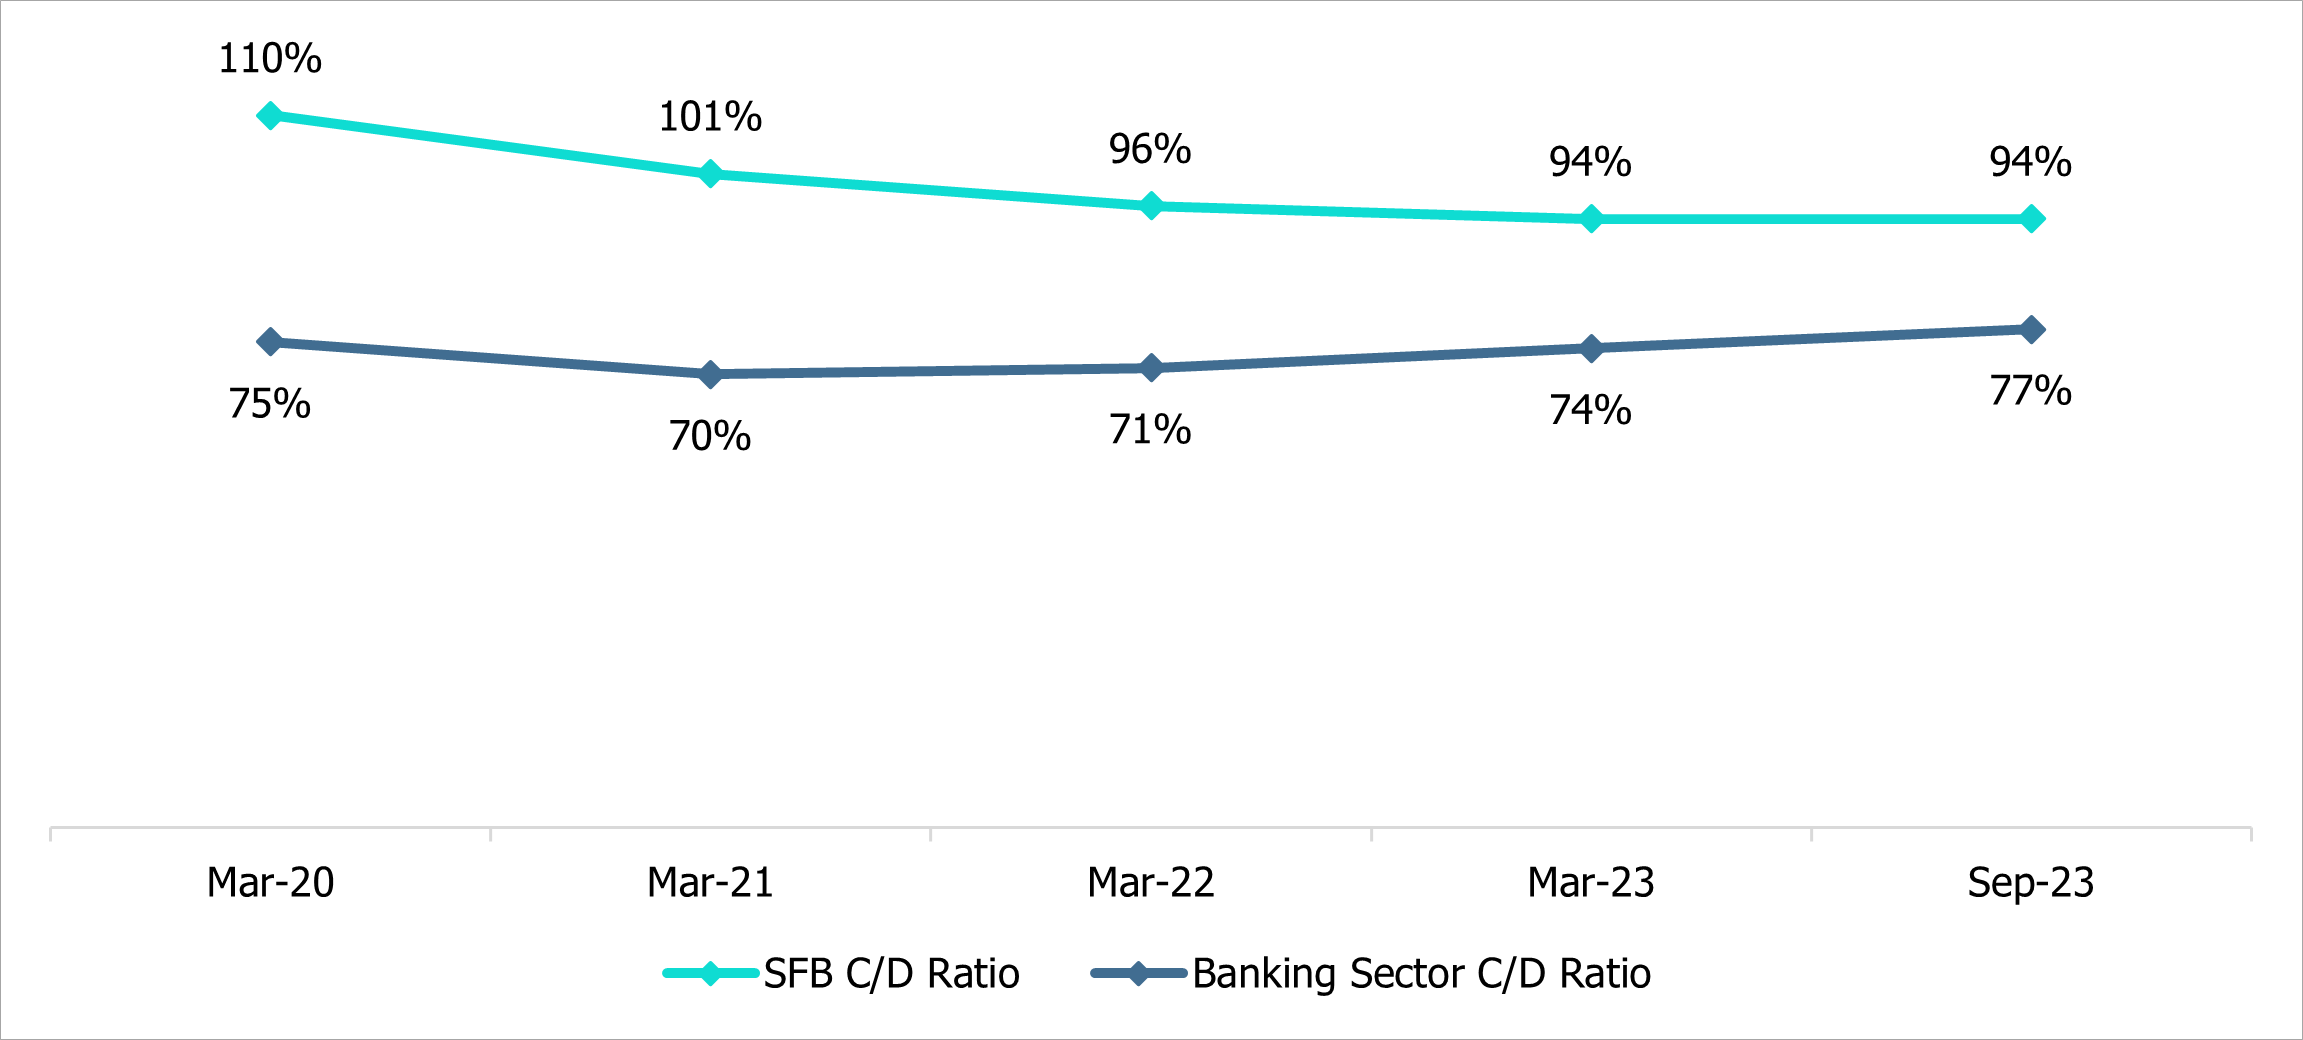
Figure 3: CASA Proportion
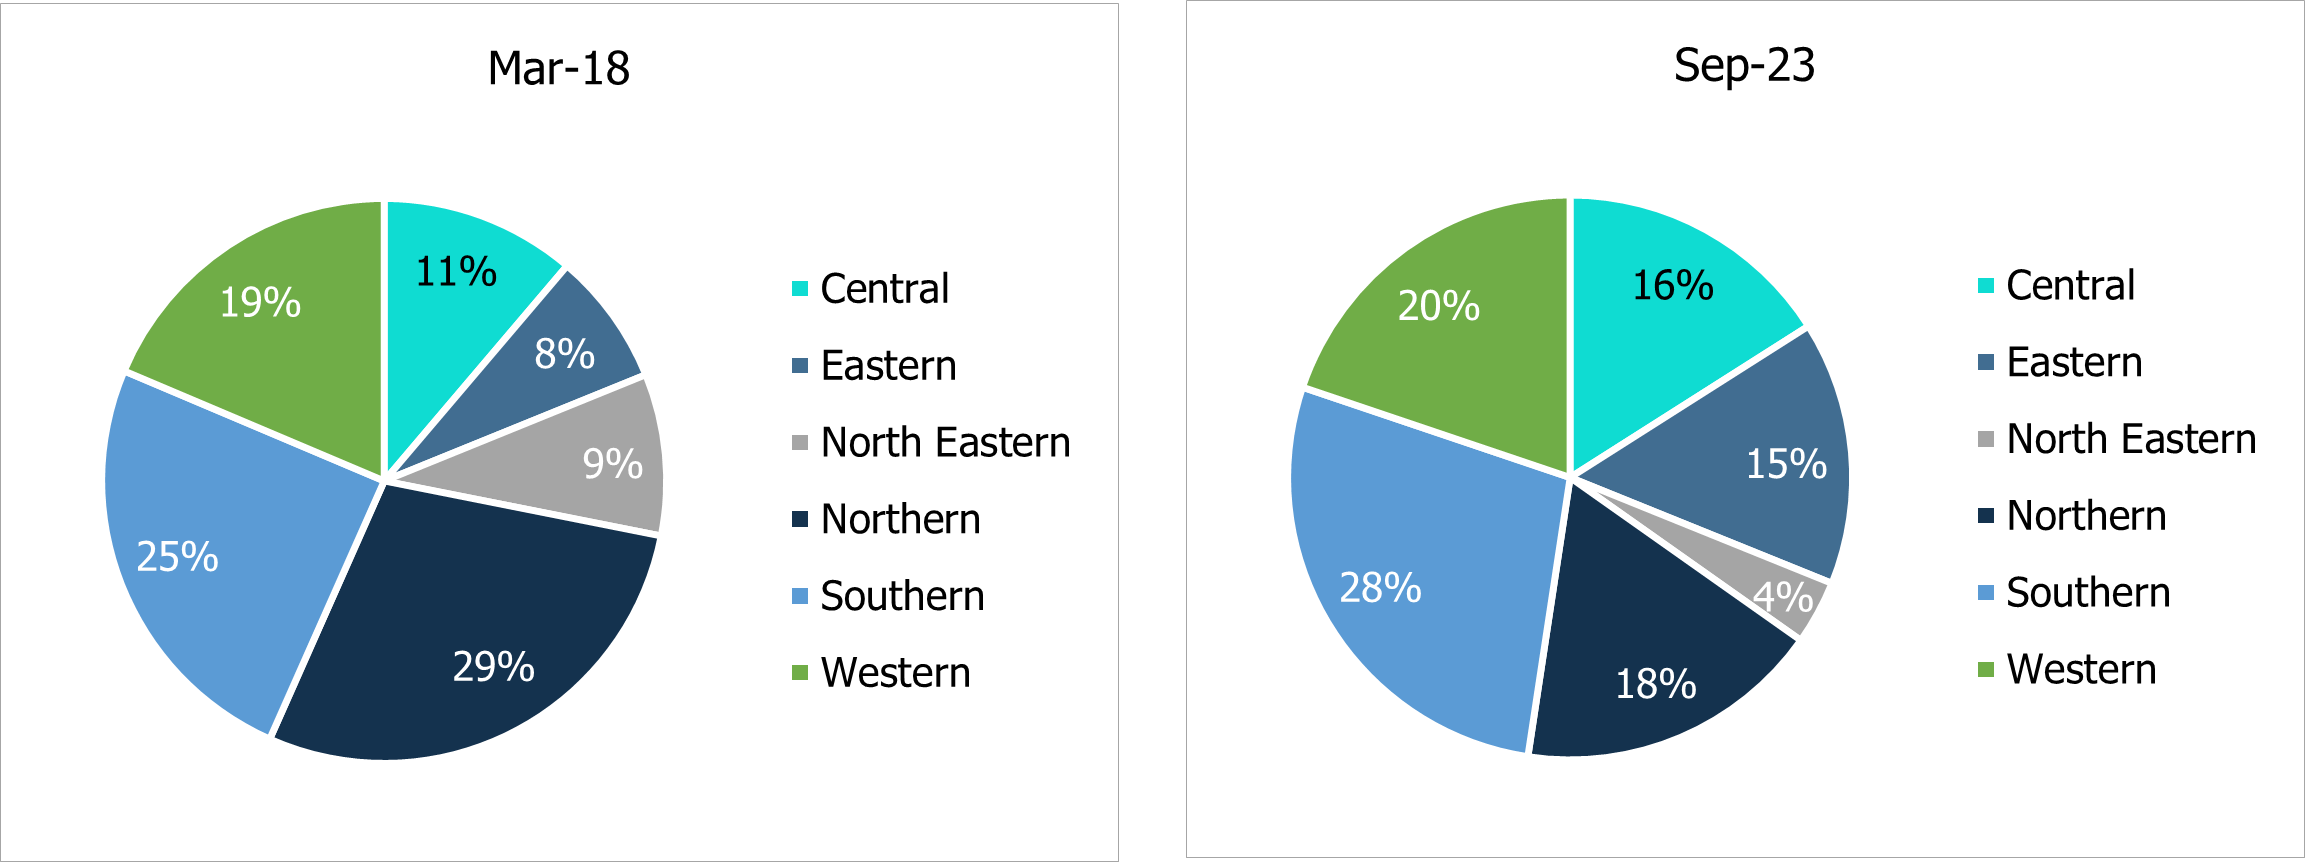
Geographical expansion underway to further financial inclusion
SFBs have been expanding their franchise continuously with a number of branches growing at a CAGR of 29% since March 2018. The branches are well spread out all over India with South India having the highest number of branches at 28% followed by the western region contributing 20%.
Figure 4: Number of branches
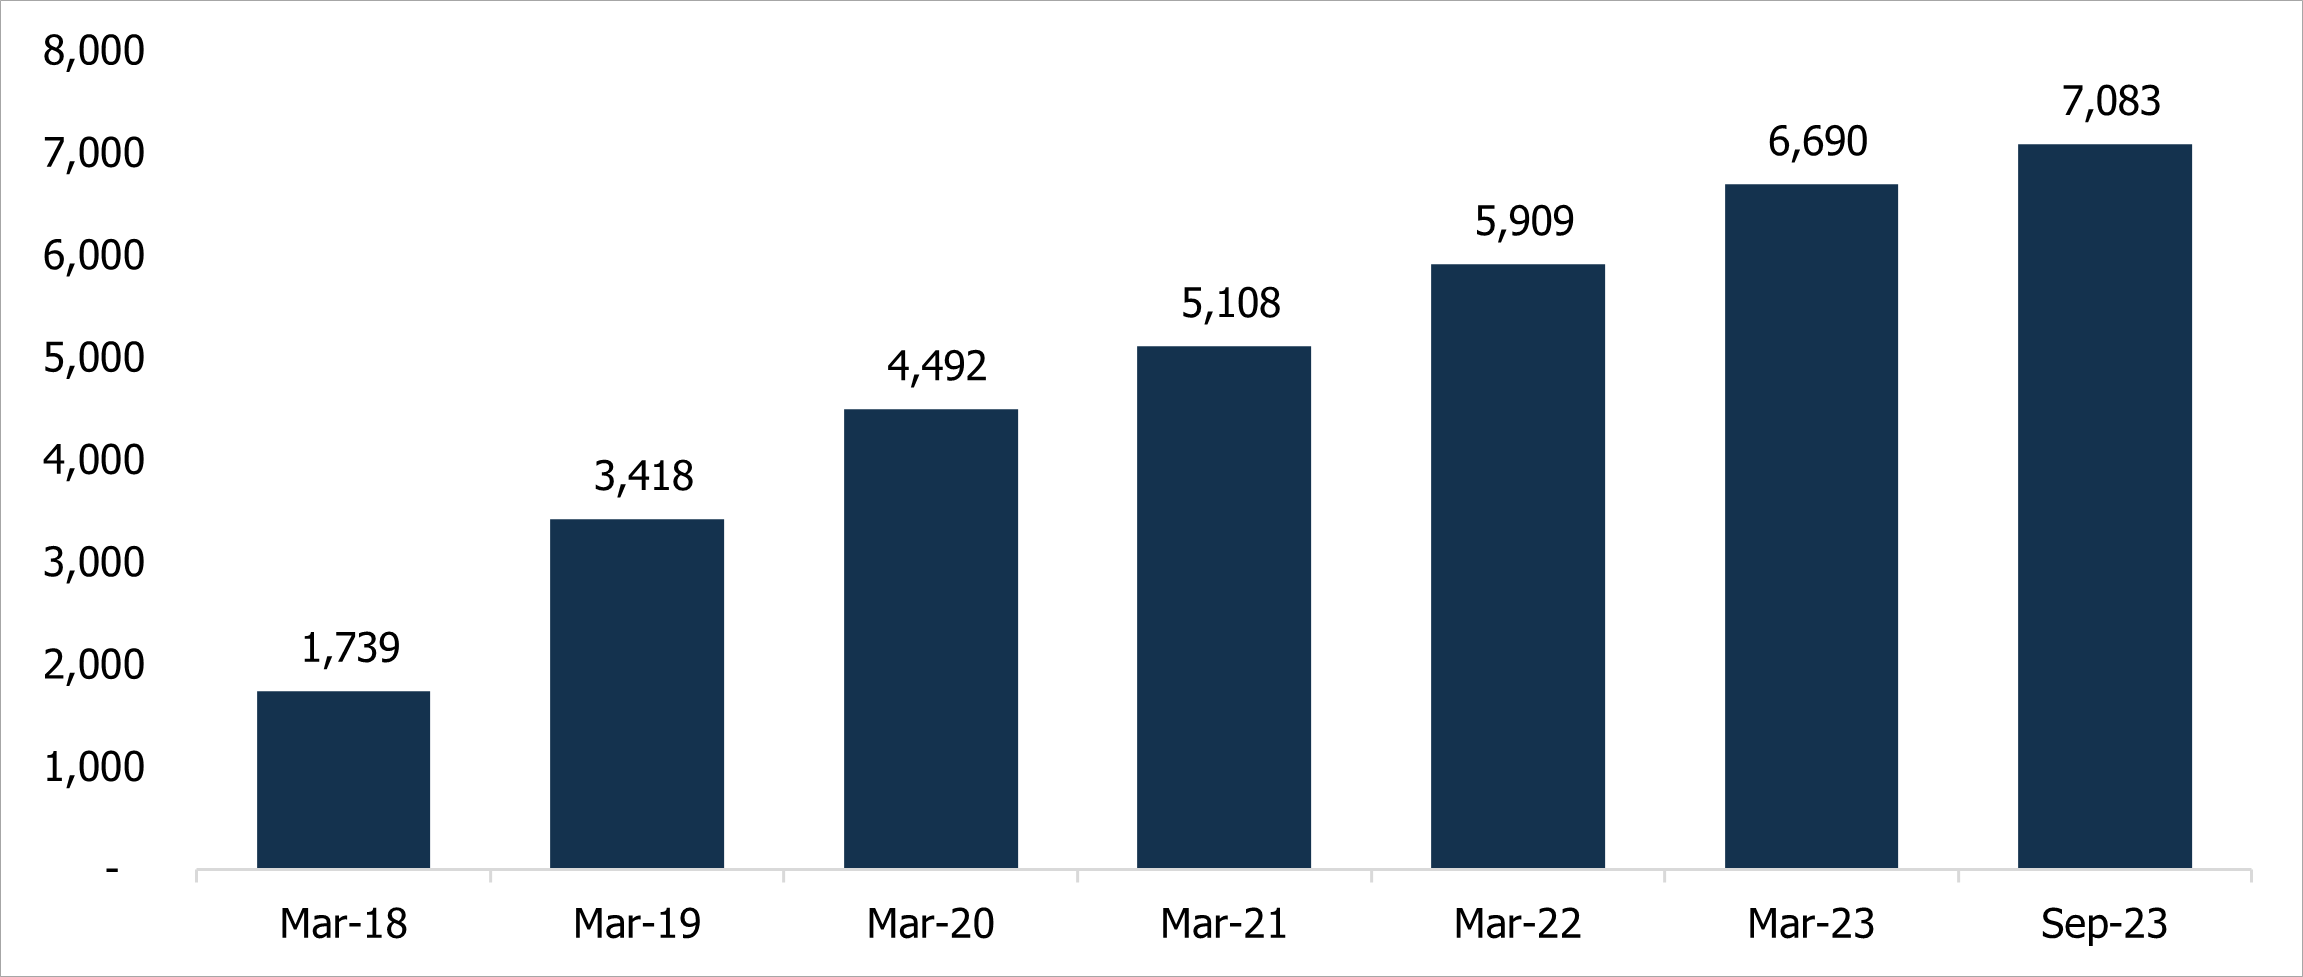
Figure 5: Geographical distribution of branches
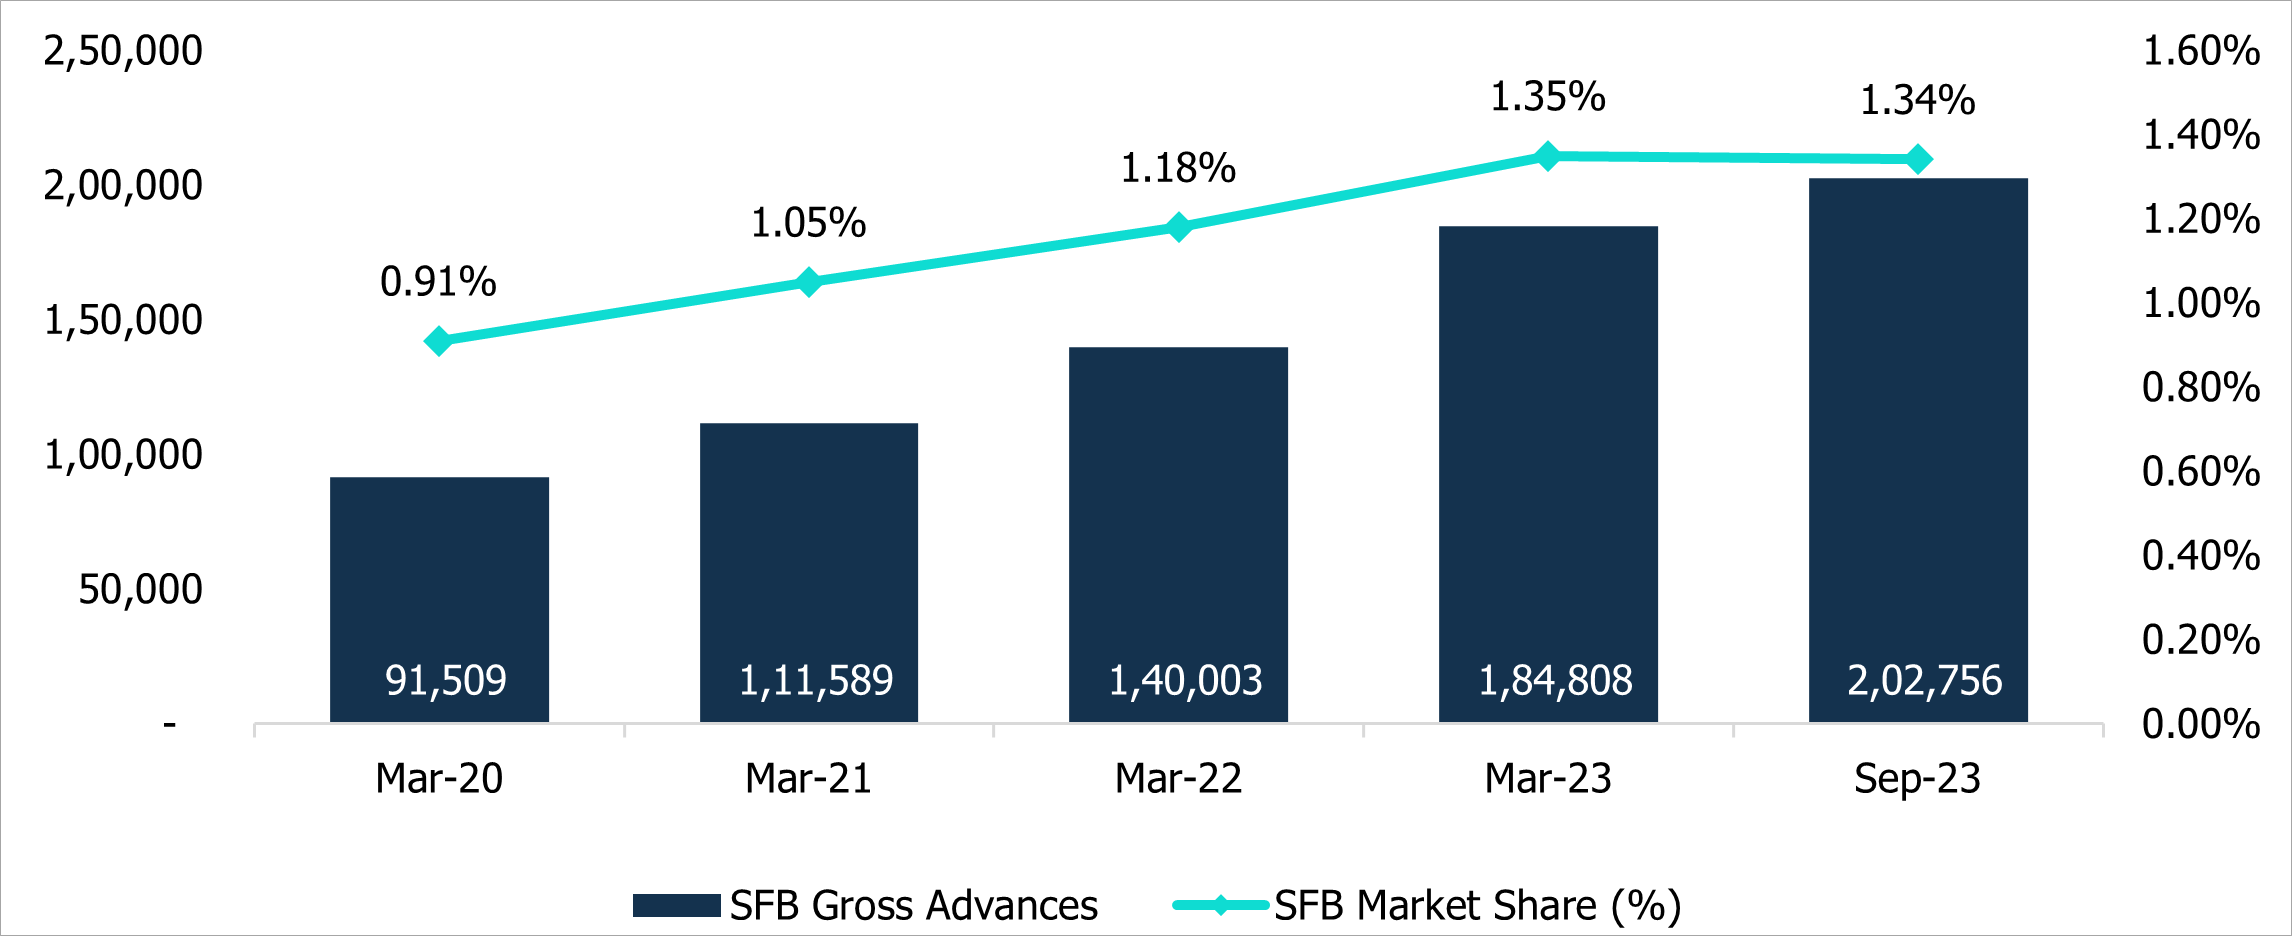
Diversification of advances visible but microfinance continues to dominate
Advances of SFBs grew at a CAGR of 32% during the period from FY20 to FY23 as against a CAGR of 11% for the banking sector. SFBs increased its market share in advances of the overall banking industry over the past few years although the same is relatively marginal.
Figure 6: Trend of Advances and Market Share
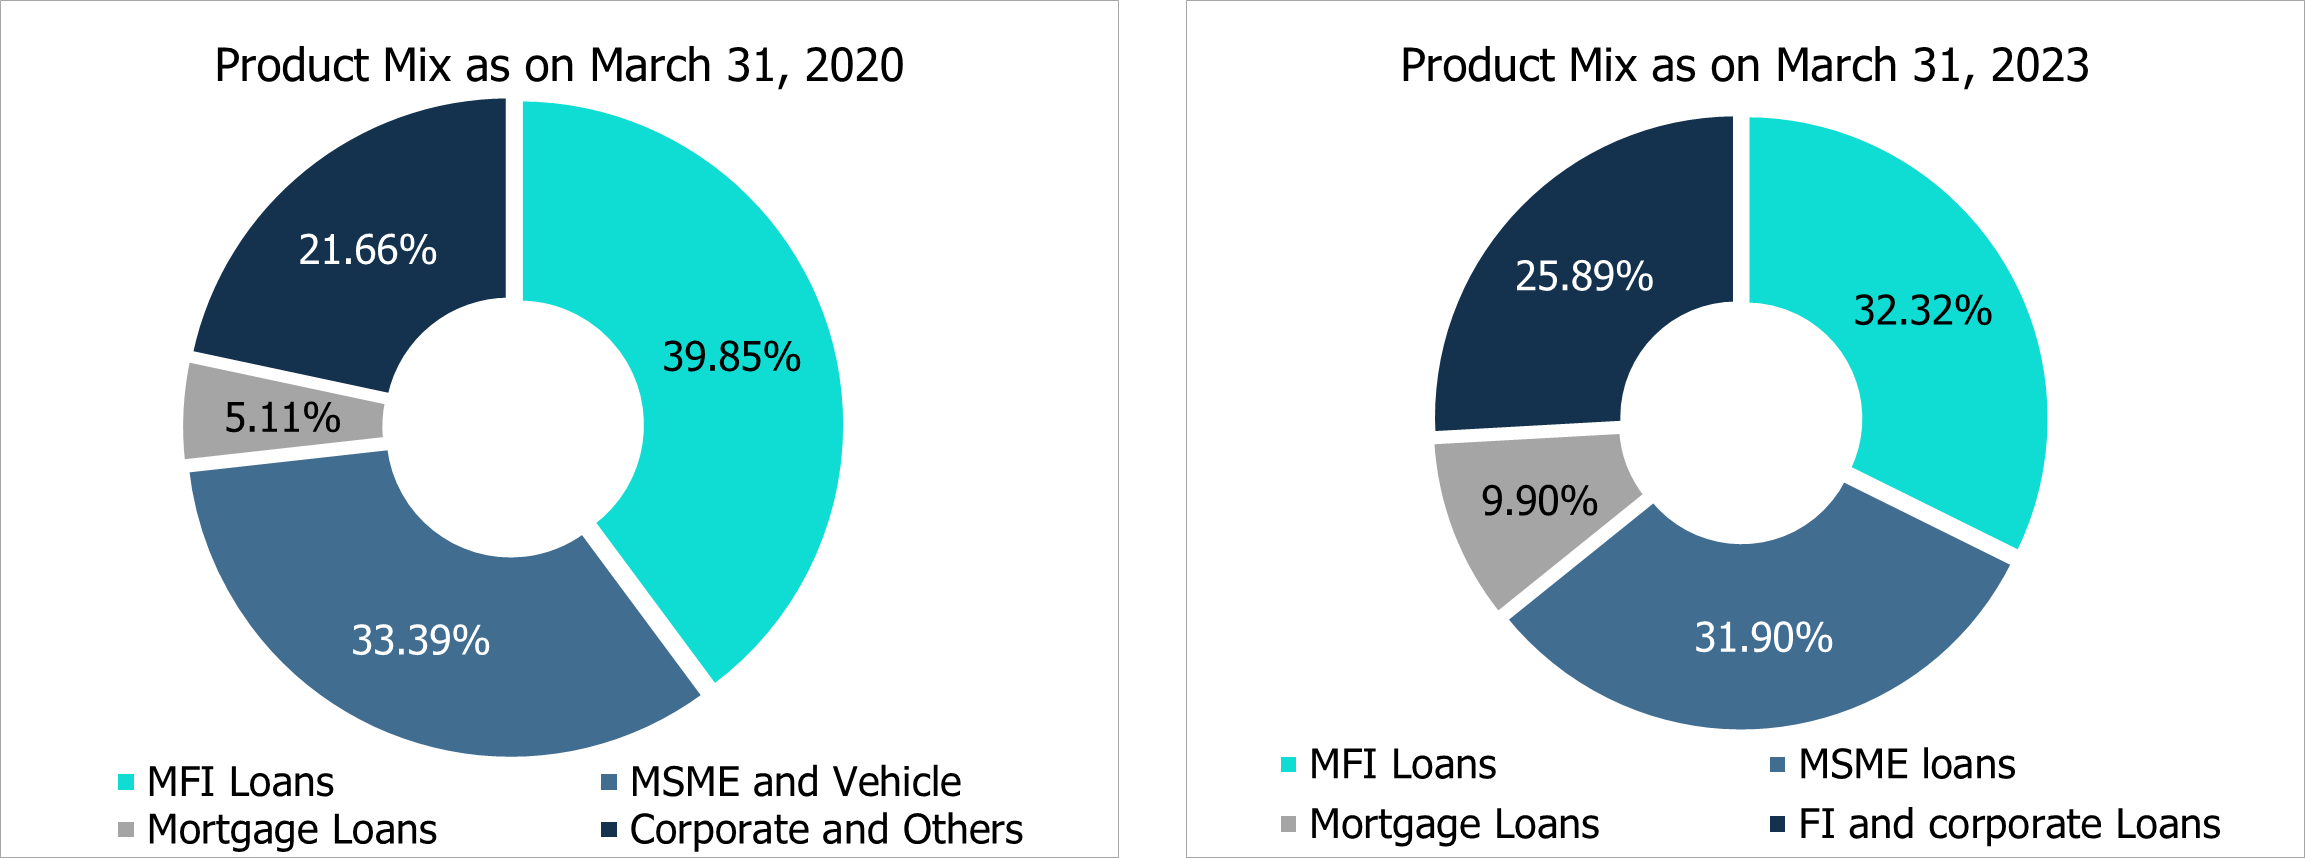
Eight out of the twelve SFBs were microfinance institutions prior to their conversion into banks, therefore the largest proportion of their loan book continues to be skewed towards microfinance which is unsecured. There has been a gradual diversification of portfolios by SFBs with an increasing share of Secured products like Home Loans, Vehicle Loans, MSME and Gold Loans resulting in the share of microfinance declining from 40% of advances as on March 31, 2020 to 32% as of March 31, 2023 for the SFB industry. The share of SFBs in microfinance loans has also been declining over a period of time.
Figure 7: Advances Mix
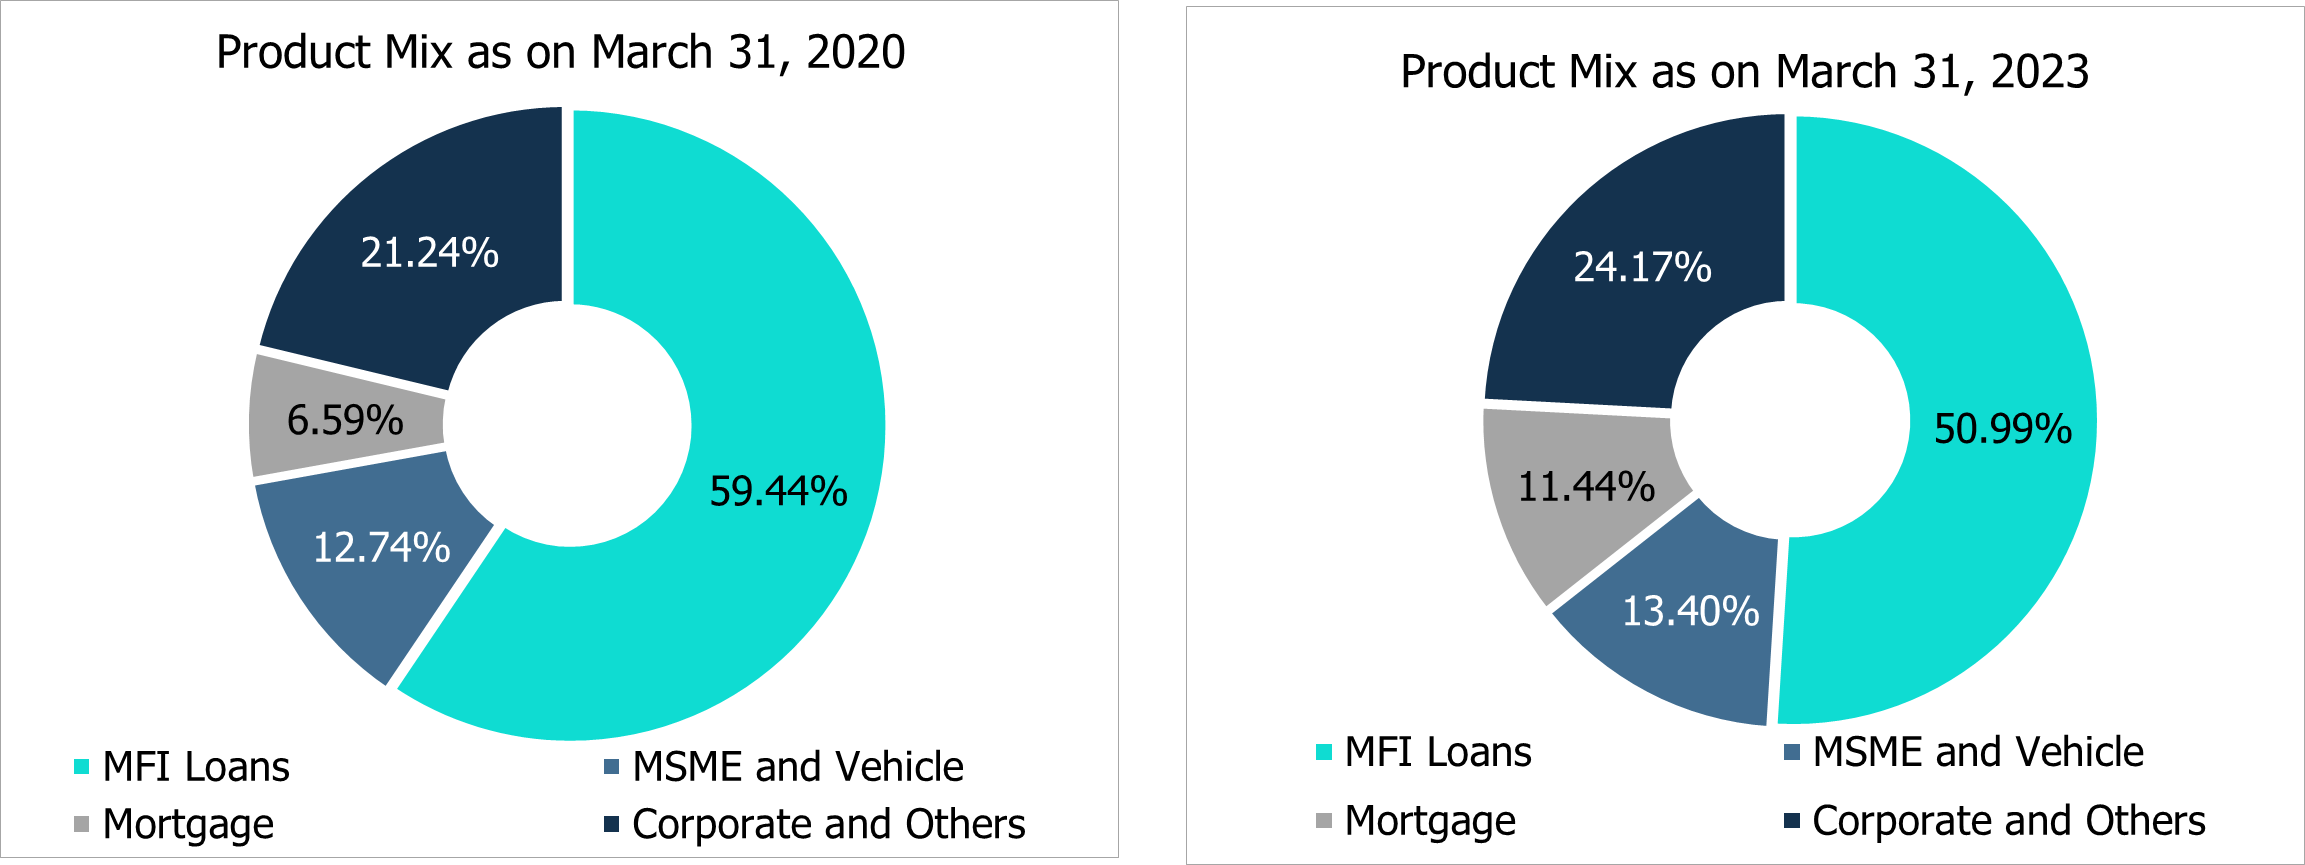
Excluding AU Small Finance Bank (the largest SFB with no microfinance exposure), the microfinance exposure has reduced from 59% as on March 31, 2020 to 51% as on March 31, 2023.
Figure 8: Advances Mix excluding AU SFB
Improvement in asset quality with a decline in credit cost
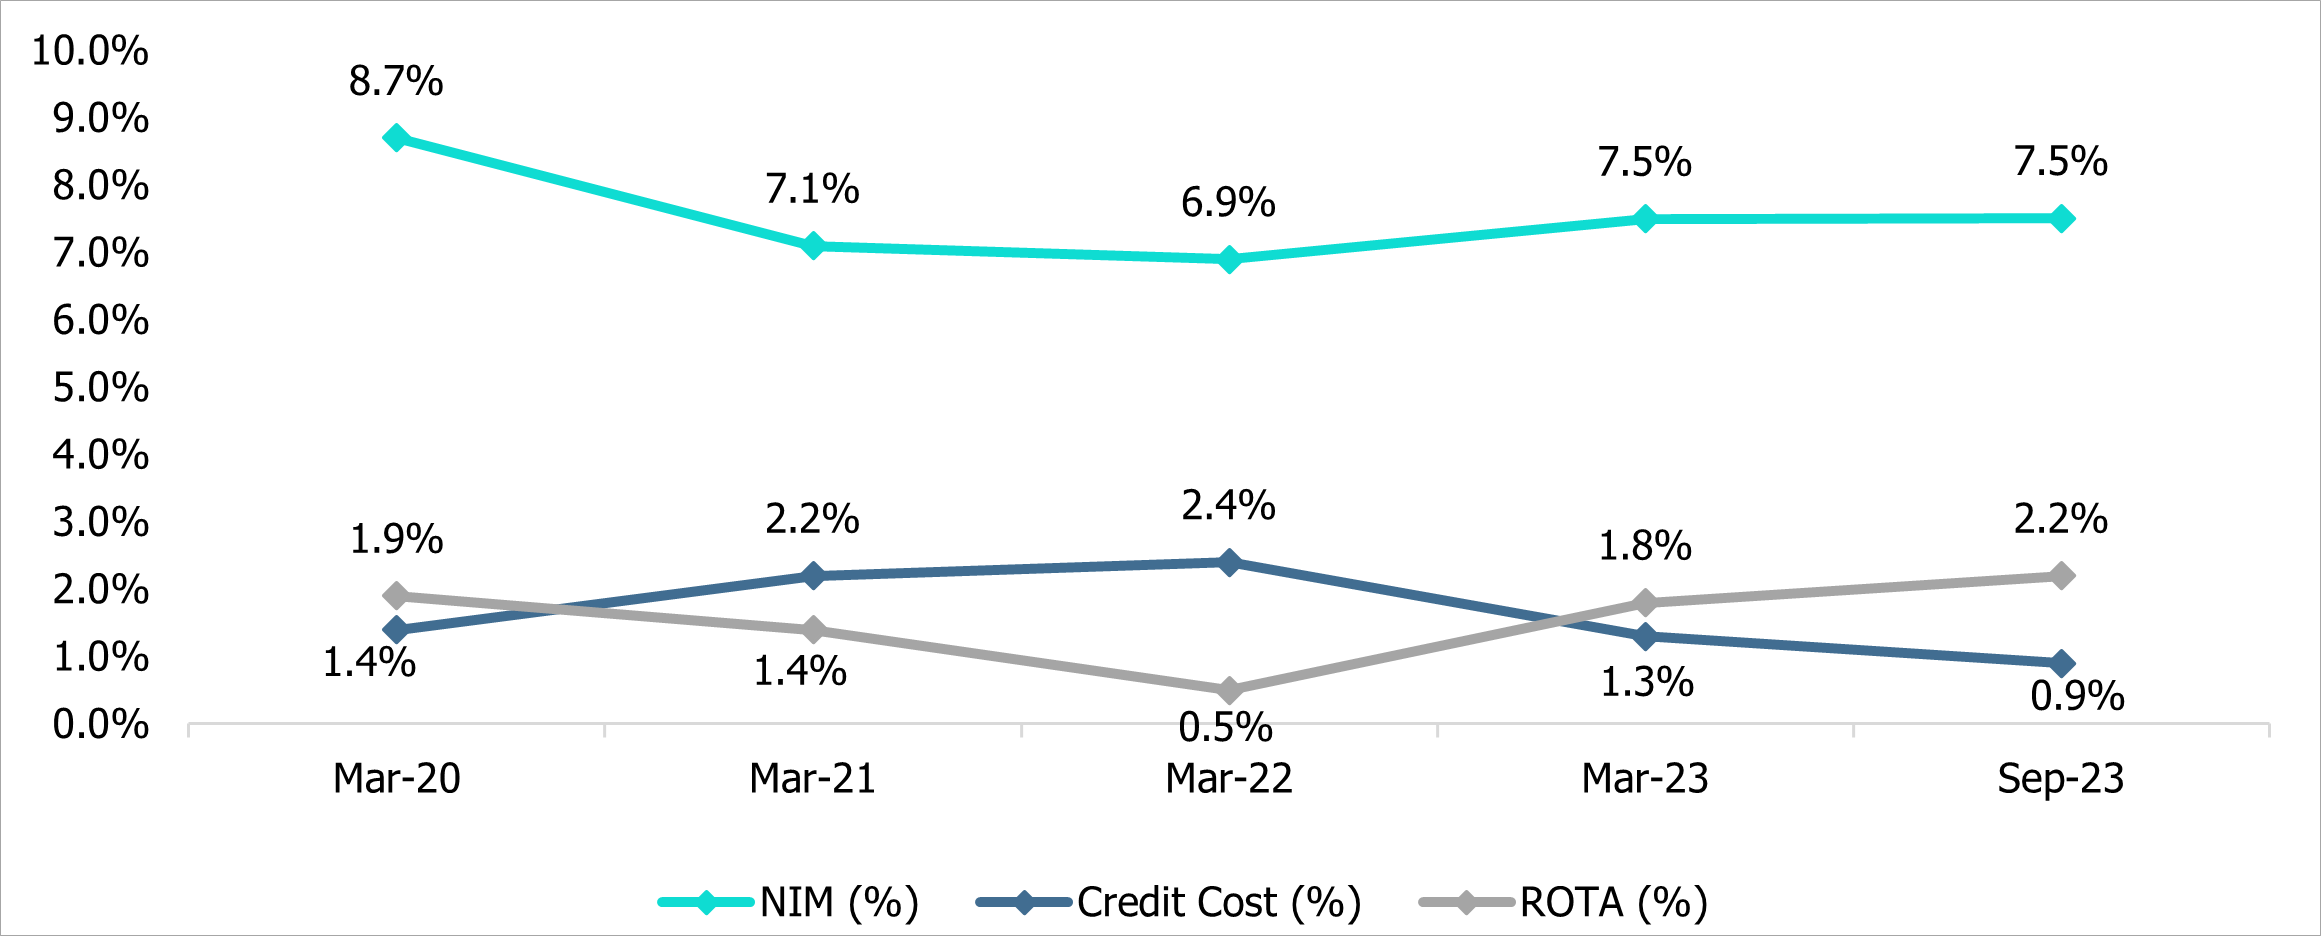
During Covid-19, SFBs especially those with larger exposure to unsecured loan books were more severely impacted due to exposure to a relatively weaker borrower segment. SFBs saw a jump in their NPAs, contributing to higher credit costs. The impact of Covid-19 peaked in FY22 when the credit cost was highest as SFBs undertook write-offs with all SFBs posting a fall of profits with few even reporting losses. With the resumption of economic activity post covid the situation started improving in FY23 with all SFBs showing improved net interest margin (NIM) thanks to rate hikes announced by RBI (FY23: 7.5% vs FY22: 6.9%) and lower credit costs as the asset quality showed improvement (FY23: 1.3% vs FY22: 2.4%) with fall in incremental delinquencies translating into superior return on total assets (ROTA). The improvements continue even in FY24 (YTD) for SFBs with NIMs holding up despite an increase in deposit rates, fall in credit cost and ROTA improvement as demonstrated in H1FY24 results.
Figure 9: Trend of Gross NPA
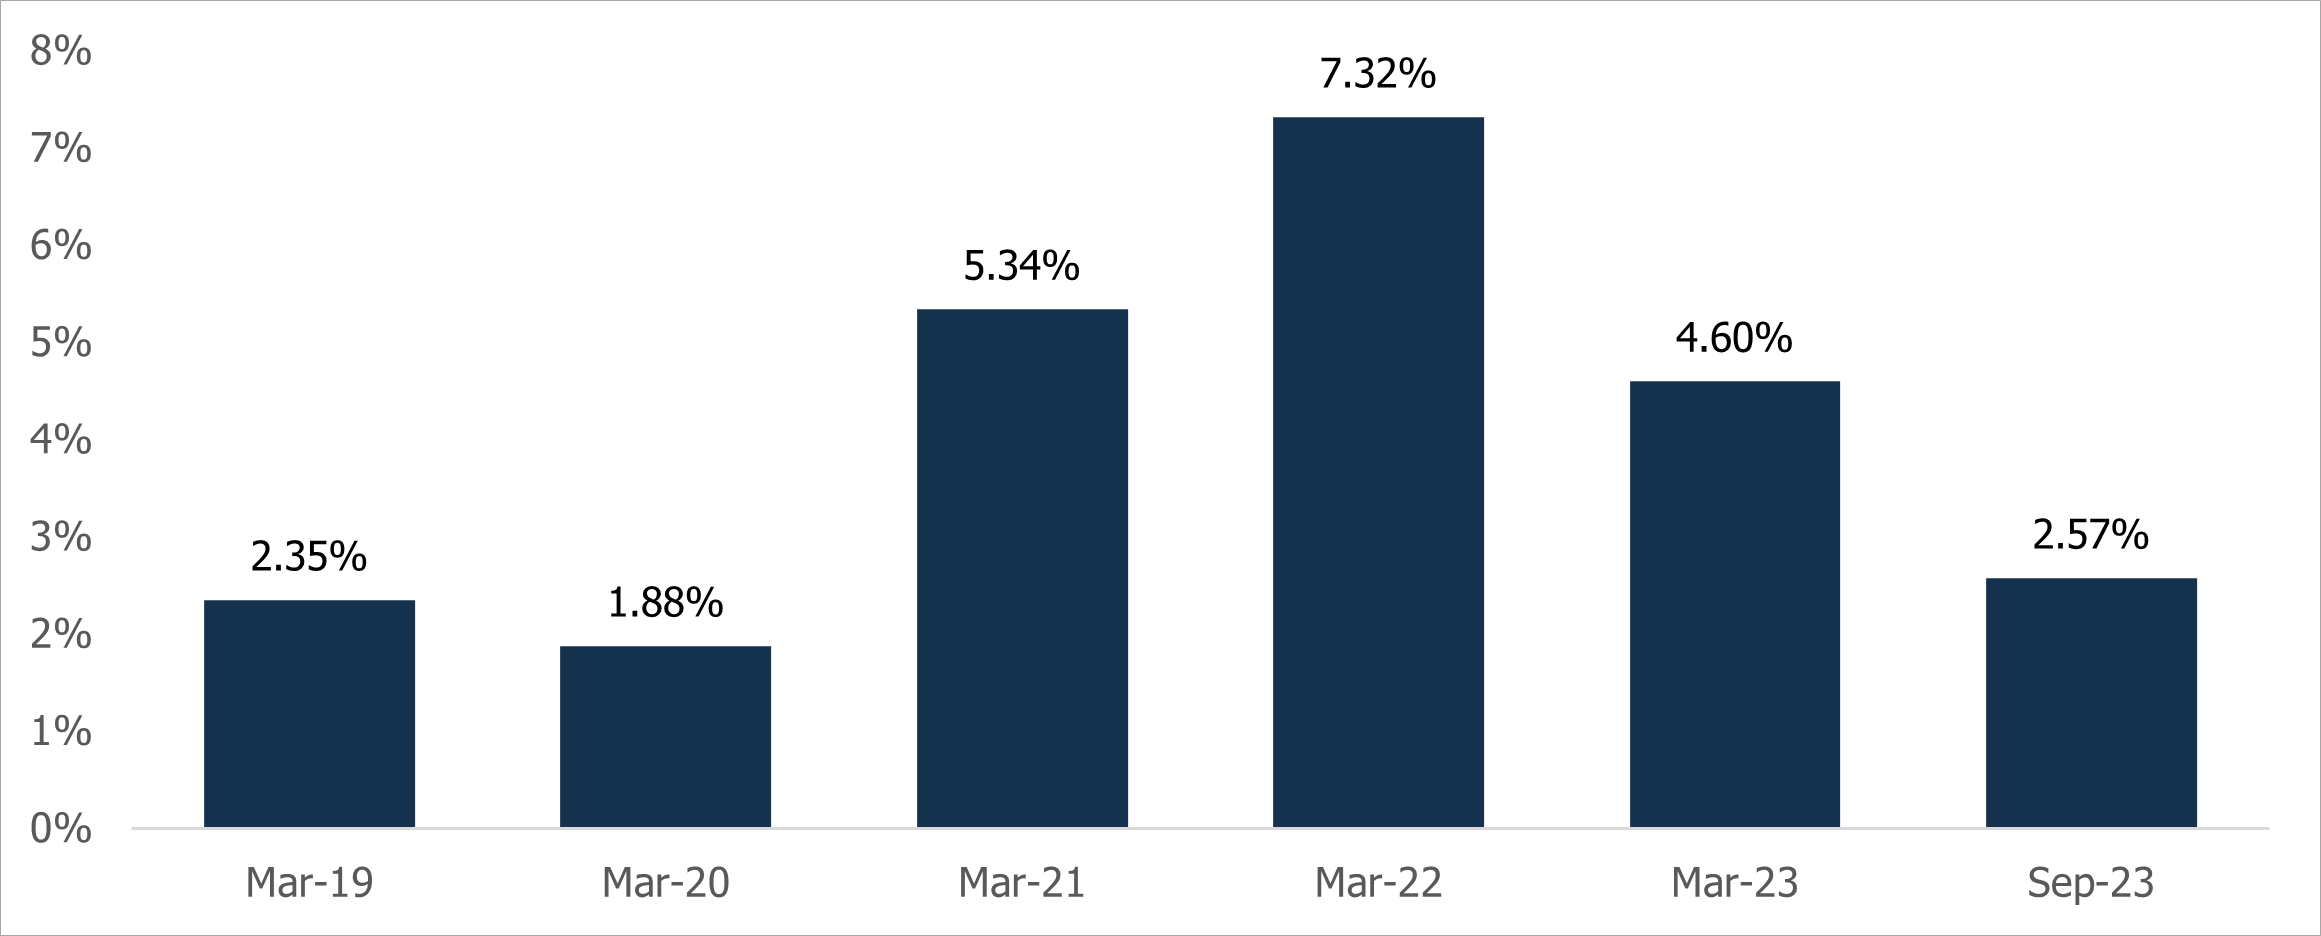
Figure 10: Profitability of SFBs
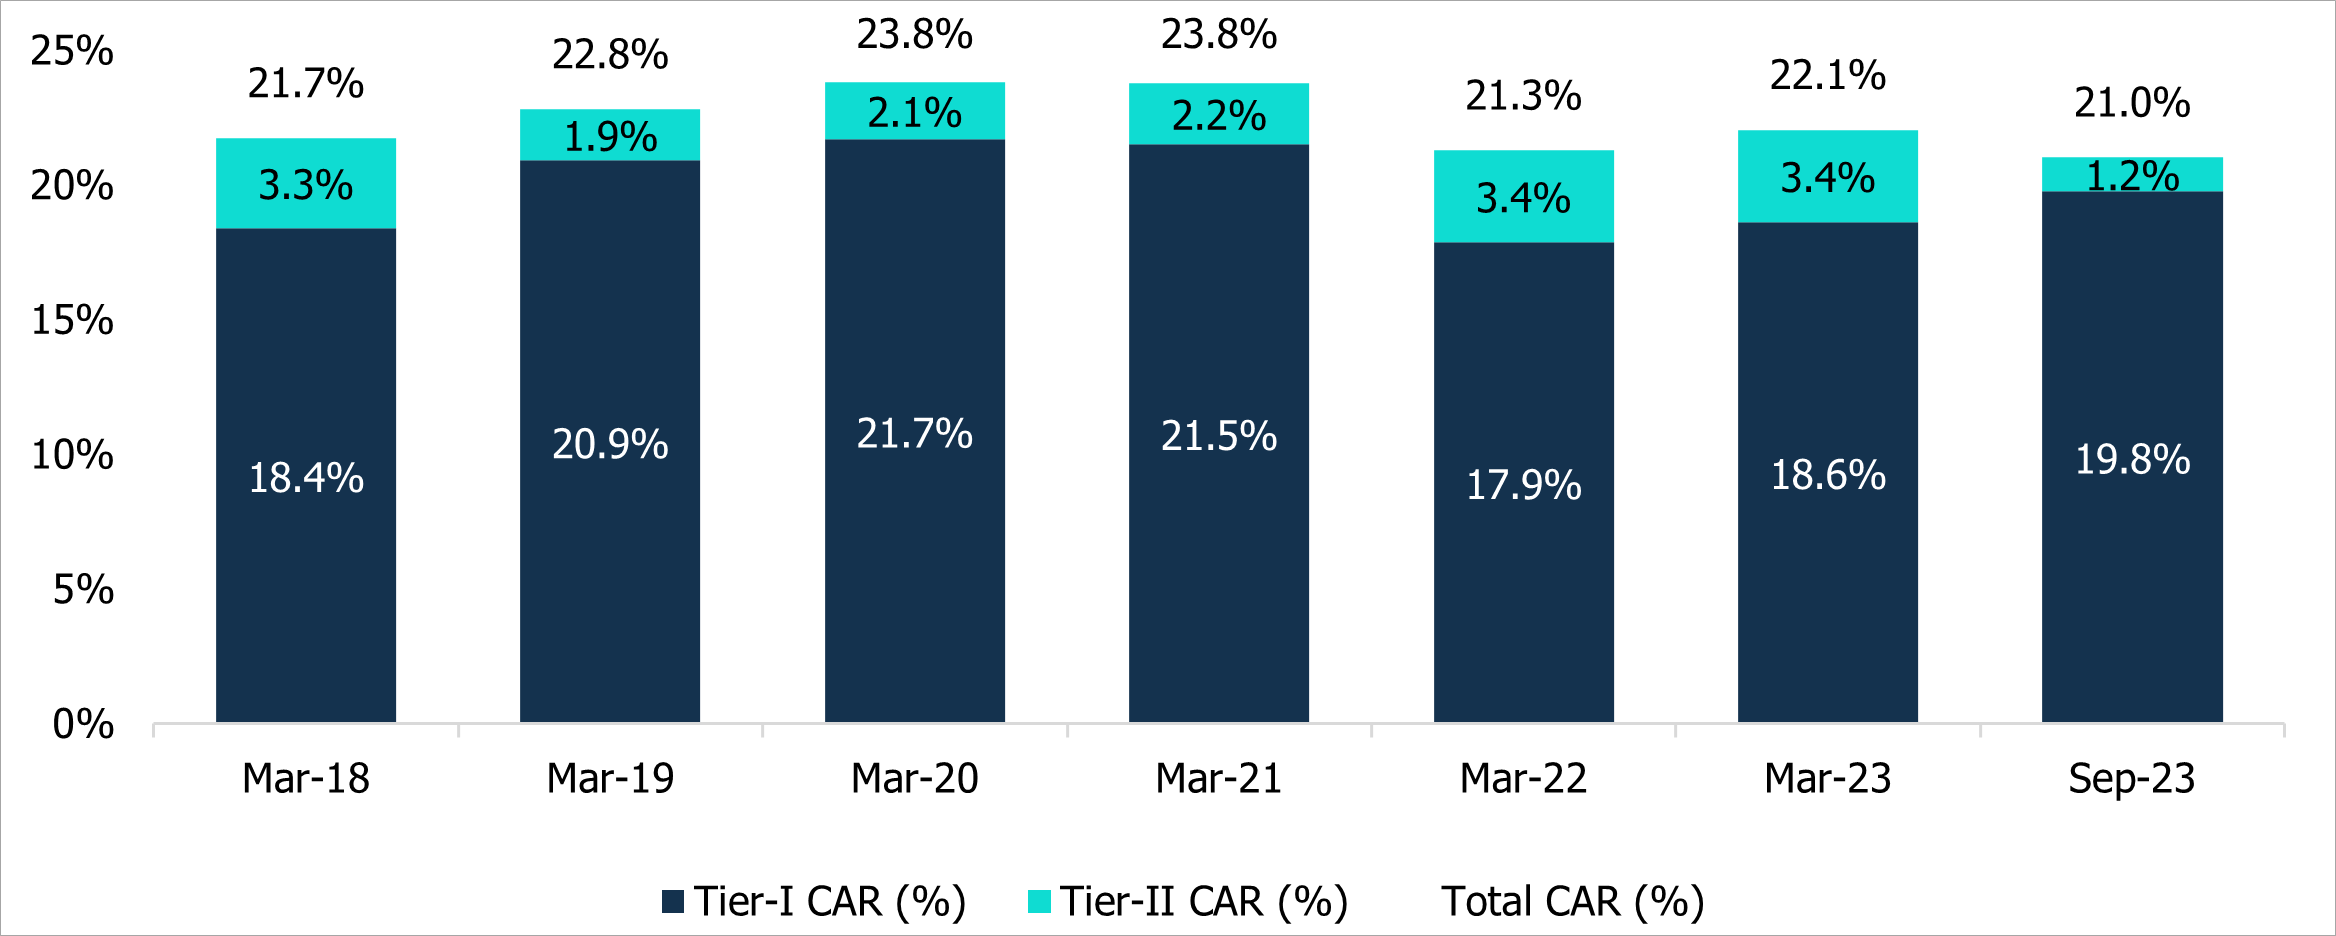
Improvement in capital cushion provides strength to grow
The CAR cushion for SFBs reduced significantly during FY22 due to losses and continued loan growth as SFBs struggled to raise capital. From FY23 onwards, the capitalization levels have improved due to profitability returning which has led to capturing investor interest enabling many SFBs to raise equity. With availability of capital, SFBs now can grow the advances book even faster than the previous year when there was a capital constraint.
Figure 11: Capital Adequacy - Median
Cumulatively SFBs raised equity capital of ₹936 crore in FY22, ₹2,956 crore and Tier II capital of ₹800 crore in FY23. During 9MFY24, SFBs have raised additional equity capital of ₹1,527 crore and are expected to further raise around ₹1,725 crore during Q24Y24 based on the DRHP filed with SEBI and other disclosures.
Figure 12: Recent capital raise by SFBs
- With the impact of Covid-19 almost over, SFBs have seen a reduction in credit costs and improvement in profitability, attracting higher investor interest resulting in more access to capital which enables them to focus on stronger growth over the medium term. Although the sector has witnessed a couple of mergers, CareEdge Ratings does not envisage any major consolidation in the industry. CareEdge Ratings expects SFBs advances and deposits to grow by 22-25% and report stable profits with ROTA in the range of 2.1% to 2.4% for FY24.
Outlook